Compile pictures with gnu pic
dot is covering the rendering of flow diagrams. Raw text files are compiled into diagrams.
What was missing was a tool that could create just simple graphics or single shapes.
This gap got now closed by GNU PIC. The tool was already installed on my system, but so far unknown to me.
The use-case
I recently had measured our garden in order to do some planning. The crude diagram did its job and provided the information I needed for my particular case, but I wanted to keep this documented a bit longer. Cleaner preferably.
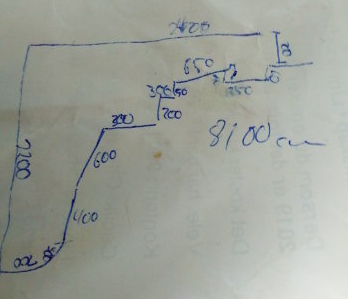
This image was no good for documentation. In less than half a year I surely will not be able to make out my own handwriting.
GNU PIC
GNU PIC takes some input and graphic specifications (like dot) and compiles it into some rendered output for Tex or groff.
- DESCRIPTION
This manual page describes the GNU version of pic, which is part of the groff document formatting system. pic compiles descriptions of pictures embedded within troff or TeX input files into commands that are under‐ stood by TeX or troff. Each picture starts with a line beginning with .PS and ends with a line beginning with .PE. Anything outside of .PS and .PE is passed through without change.
The syntax and usage is well documented, e.g. in the document PIC A Graphics Language for Typesetting Revised User Manual.
The following example will draw a triangle with a side length of three inches:
1.PS
2line right 3 up 3 "c";
3line down 3 "a";
4line left 3 "b";
5.PE
I am gonna use this to see if this can be rendered into a presentable image.
So this needs to be fed into the next tool
$ cat input.me
pic2graph
The second player in the assemble is pic2graph.
- DESCRIPTION
Reads a PIC program as input; produces an image file (by default in Portable Network Graphics format) suit‐ able for the Web as output. Also translates eqn(1) constructs, so it can be used for generating images of mathematical formulae.
Using this, the input language from PIC can be used to generate images from compiled text files. It makes use of pic, convert (from ImageMagick), gs, eqn and groff to drop the graphic file.
The important detail is a bit further down the man-page:
Your input PIC code should not be wrapped with the .PS and .PE macros that normally guard it within groff(1) macros.
Otherwise pic2graph does not have many parameters available. Any additional parameter will be forwarded to convert. Something that makes it easy to put some adjustments in when necessary.
$ cat input.me | pic2graph > output.png
This creates a transparent PNG file with the triangle defined. That means some more parameters need to be passed to convert.
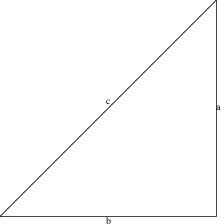
The transparent PNG images shows up with a white background on this web-page.
convert
The generated image is a transparent PNG image. So some nice white background would be nice. The parameter -background will actually do that and set the background color to the default color white. Additionally we have to remove the alpha channel to make the change visible.
-background white -alpha remove -alpha off
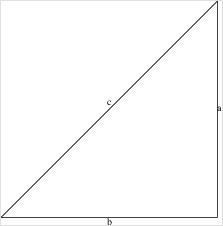
On the right image border and top, I could use some more space. The parameter -border will force convert to add additional space. The default color unfortunately is not white, so we use -bordercolor to change that.
-border 10 -bordercolor white
This needs to be passed to convert from pic2graph:
cat input.me | pic2graph -background white -alpha remove -alpha off -border 10 -bordercolor gray > output.png
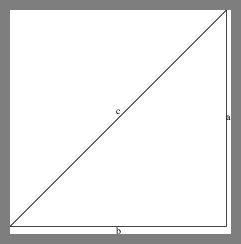
The drawing
The following code for the input.me generates the handwritten diagram as PNG file.
 1# Gardenshape
 2line right 26.50 "2650cm" below;
 3line dotted down 2 "200cm" rjust;
 4move right 5;
 5move left 5;
 6line down 0.5 "50cm" ljust;
 7line left 2.5 "250cm" below;
 8line up 0.5 "50cm" ljust;
 9line left 6.5 "650cm" below;
10line down 0.5 "50cm" rjust;
11line left 3 "300cm" below;
12line down 2 "200cm" ljust;
13line left 3 "300cm" below;
14line down 6 left 1.5 "600cm" ljust;
15line down 4 "400cm" ljust;
16move down 3 left 3;
17arc up 3 right 3 rad 3 "300cm";
18move down 3 left 3;
19line left 2 "200cm" below;
20line to 0,0 "2200cm" ljust;
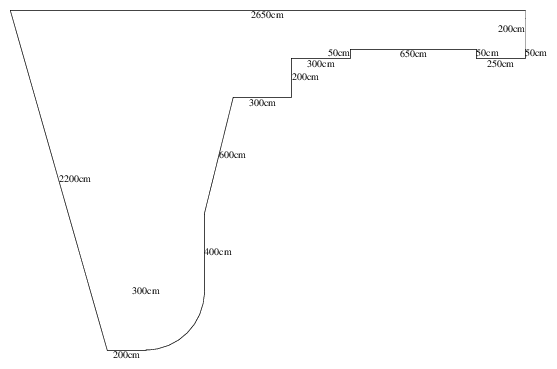
At this point the whole chain from a) putting the code in there to getting the z) getting the image rendered works. Time to put the real world code into the file input.me.
Lessons learned
During looking and playing with pic, pic2graph and convert and writing this article, I’ve been forced to look quite close on the commands and parameters to use to make sure everything is correct.
These are the lessons I’ve learned during this:
pic: The syntax is quite straight forward. Define an object, its dimensions and the following object will continue where the previous one will left of. However: I initially started in the lower left corner of the drawing. That left me with the problem of the left straight line that has an angle. I would have to guess the target coordinates. After I changes this and put the start location in the top left corner and work around the drawing clockwise, the last line line to 0,0 automatically completes the drawing.
pic2graph: Not sure why, but rendering the graph cuts off parts on the right hand side. I’ve addressed this with the lines four and five (move right 5; move left 5). That puts the next object exactly at the location where the previous left off, but executes a kind of side-step to increase the defined image size.
-flatten: Initially I used the parameter -flatten for convert to assign the default background color. This also had the side-effect on unnecessarily increasing the canvas size. Replacing this with -background, -backgroundcolor, and -alpha created a better sized image.
There was no need to look at groff or pic in details. The syntax in combination with pic2graph was enough to get it working.
Bonus
I’ve just put the rendering command in a Makefile to make it easy to render in the future:
1%.png: %.me
2  cat $< | pic2graph -background white -alpha remove -alpha off -border 10 -bordercolor white > $@